
Your DataFrame's Visual Analytics Companion
PyGWalker turns your data into interactive visualization apps with one line of code, and enables you to share your apps with one click.
Thousands of developers and data professionals worldwide trust PyGWalker
13K
Github Stars
1.35m
package downloads
IEEE VIS 2024
Best short paper

Most popular
python visualization library in 2023/2024
Top 1
in Hacker News
Data to Visualization App with Ease
PyGWalker turns your data into interactive visualization apps with one line of code, and enables you to share your apps with one click.
Step1: Install PyGWalker
Get started by installing PyGWalker using pip (pip install pygwalker) or conda (conda install pygwalker).
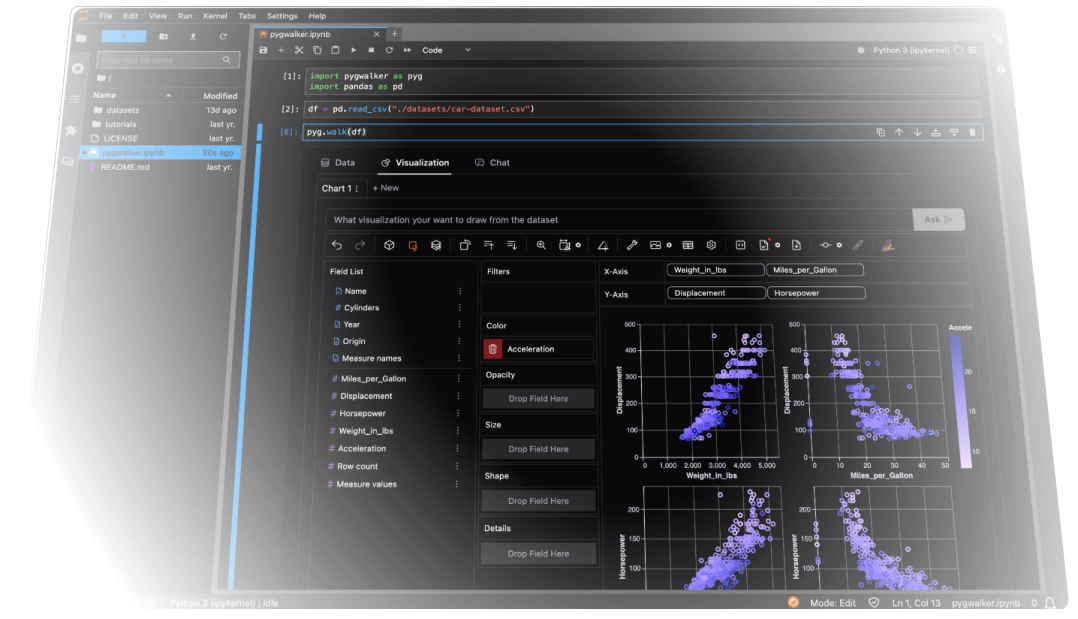
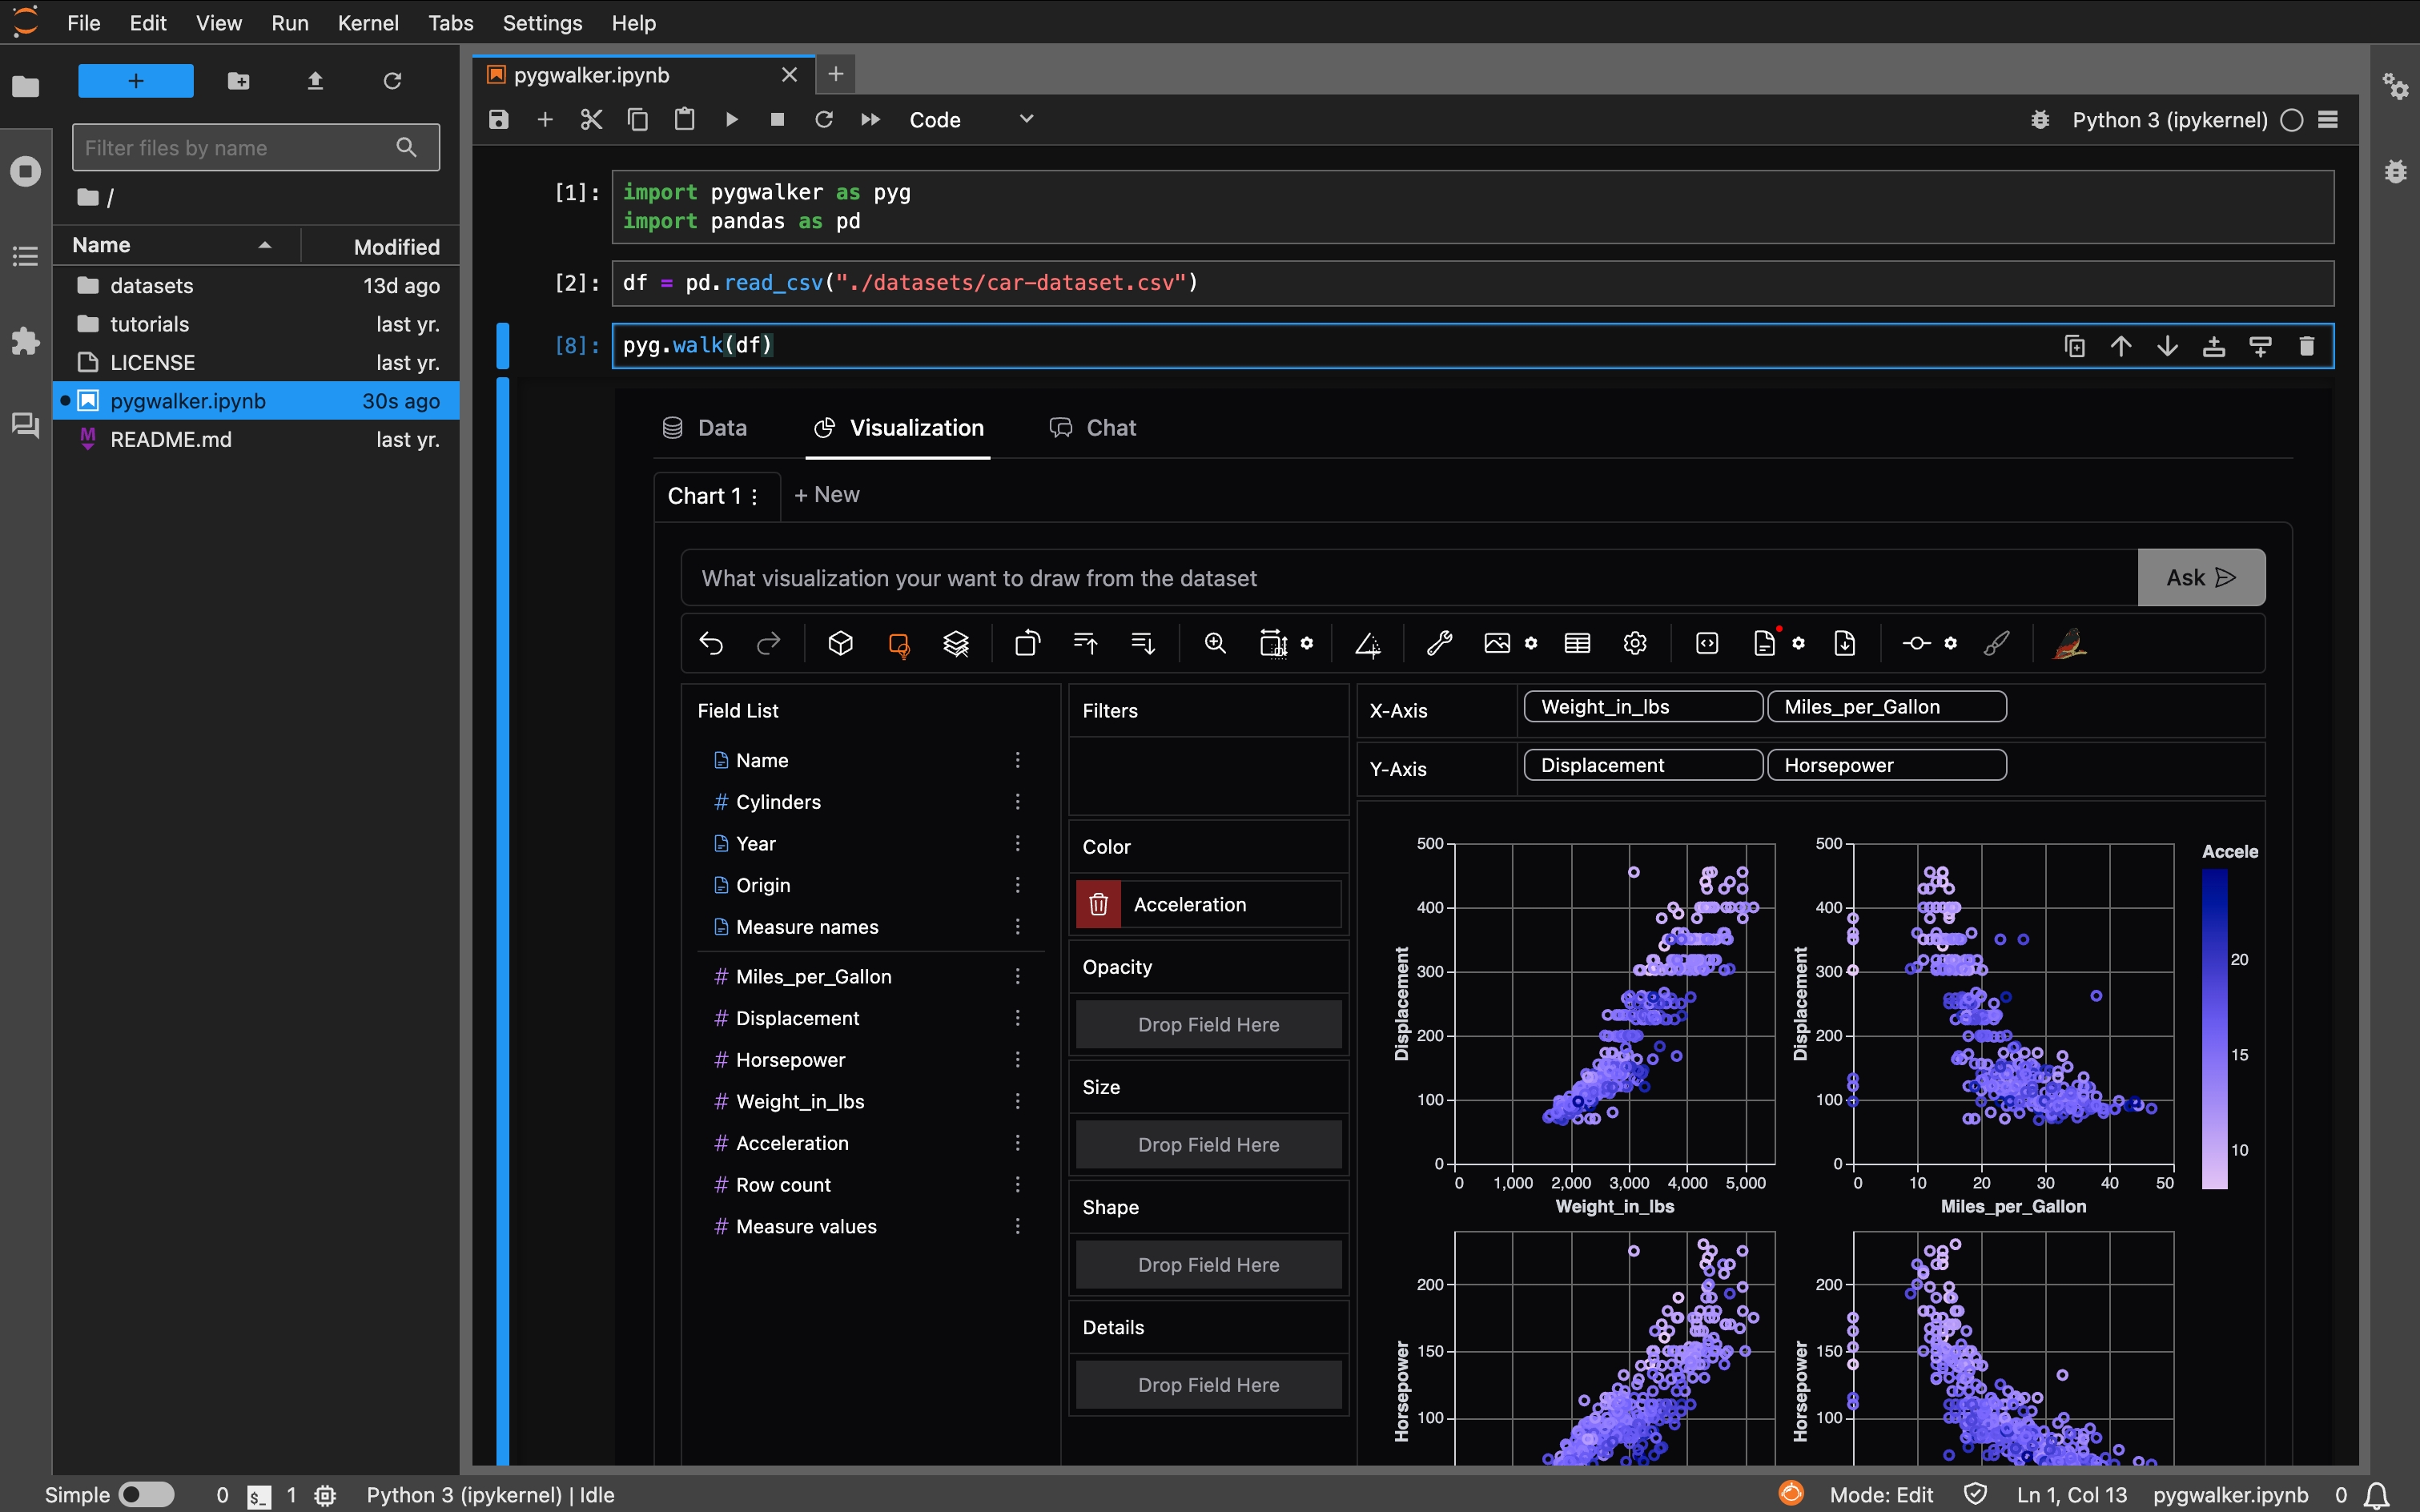
Step2: Load Your Data
Import PyGWalker and turn your dataframe into interactive component with pygwalker.walk(dataframe).
Step3: Explore & Visualize
Make visualizations with simple drag and drop operations or natural language commands.
Features make visualization simple
PyGWalker provides a set of features that make data analysis much simpler, and always be scalable.
Data Cleaning Can be Easy
PyGWalker's Data Painter allows you to clean your data with an "eraser"; you can remove outliers, clusters and complex patterns within seconds.
Annotation with Ad Hoc Analysis
Create new variables, labels, and features without breaking your analysis workflow. Data Painter allows you to create new features on your analytical views in real-time.
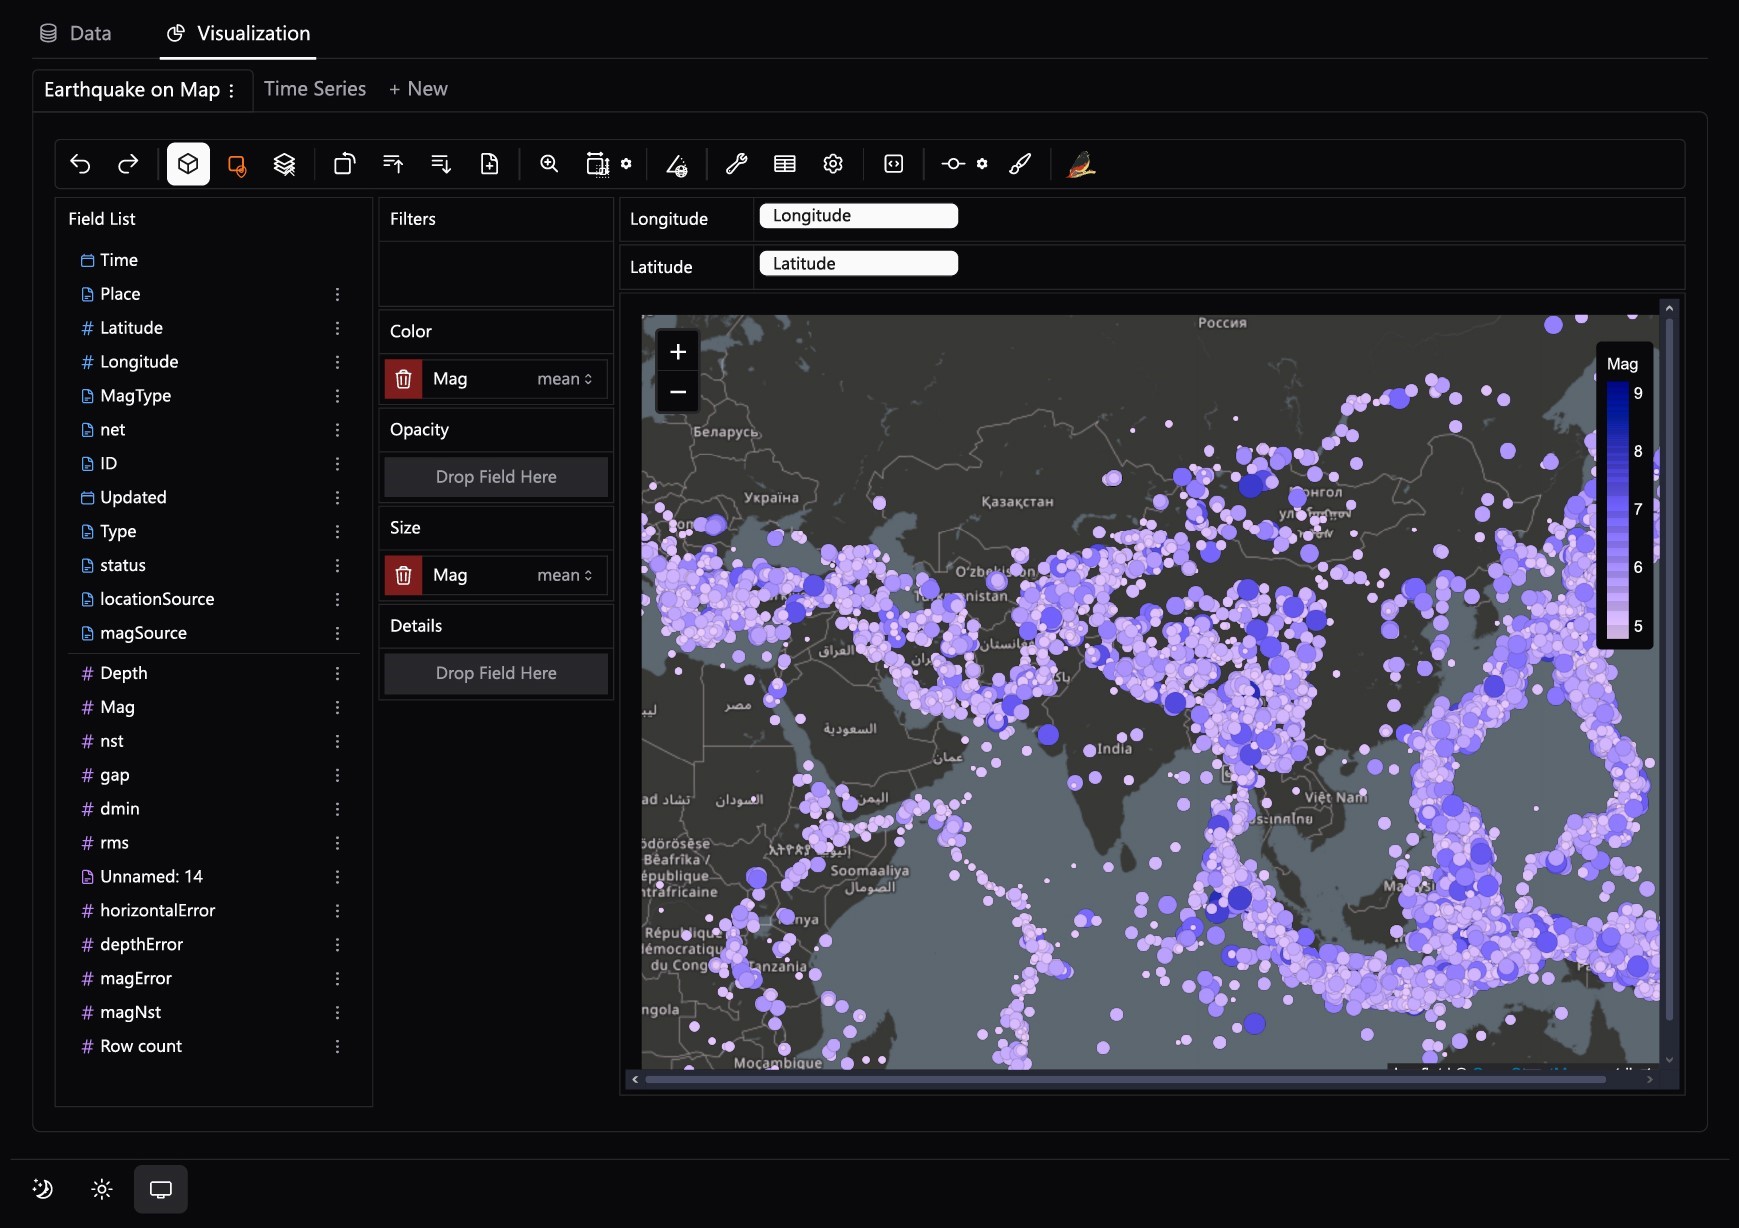
Map Your Data with a Few Clicks
Create interactive maps instantly from your geographic data. Zoom, pan, and explore your data points with intuitive controls. Perfect for visualizing location-based patterns in your DataFrame — no mapping expertise required.
High performance / scalable
Process massive datasets with industry-leading speed and efficiency. PyGWalker by default handles queries in a high performance engine based on duckDB. It also allows connecting to external clusters for large scale of data like Snowflake, ClickHouse.

Framework Integration
Works with Jupyter, Streamlit, Gradio, and Plotly Dash, enabling smooth embedding into your existing workflows.

Connecting Databases
Not only can you connect most common databases to PyGWalker, but you can use all services supporting SQL as a query engine for PyGWalker as well. In this way, PyGWalker can scale for large data processing.

Visualize with few lines of code
PyGWalker simplifies data analysis with powerful features, easily integrated into Jupyter and more, using just a few lines of code.
[1]:import pandas as pd
from pygwalker.api.jupyter import JupyterRenderer
df = pd.read_csv("./bike_sharing_dc.csv")
renderer = JupyterRenderer(df)
renderer.explorer()Frequently asked questions
PyGWalker is an open source project that is constantly evolving. Here are some common questions about PyGWalker.
Ready to Unlock the Visual Power of Your Data?
Free and open-source, PyGWalker is a Python library that enables you to transform your data into a fully interactive visual exploration interface with just one line of code.
Need an online tool to make charts from your data? Try our Chart Maker.