Potenti strumenti di visualizzazione dati
Scegli lo strumento perfetto per il tuo flusso di analisi: dai notebook Python agli ambienti R, dalle app web alle applicazioni desktop.
Runcell.dev
Agente codice AI nel tuo notebook Jupyter. Può comprendere il codice e i dati nel tuo notebook e aiutarti con l'analisi.
- •Agente di codice completamente automatico
- •Completamento del codice in linea per Jupyter Notebook
- •Suggerimento per il passaggio successivo da parte dell'intelligenza artificiale
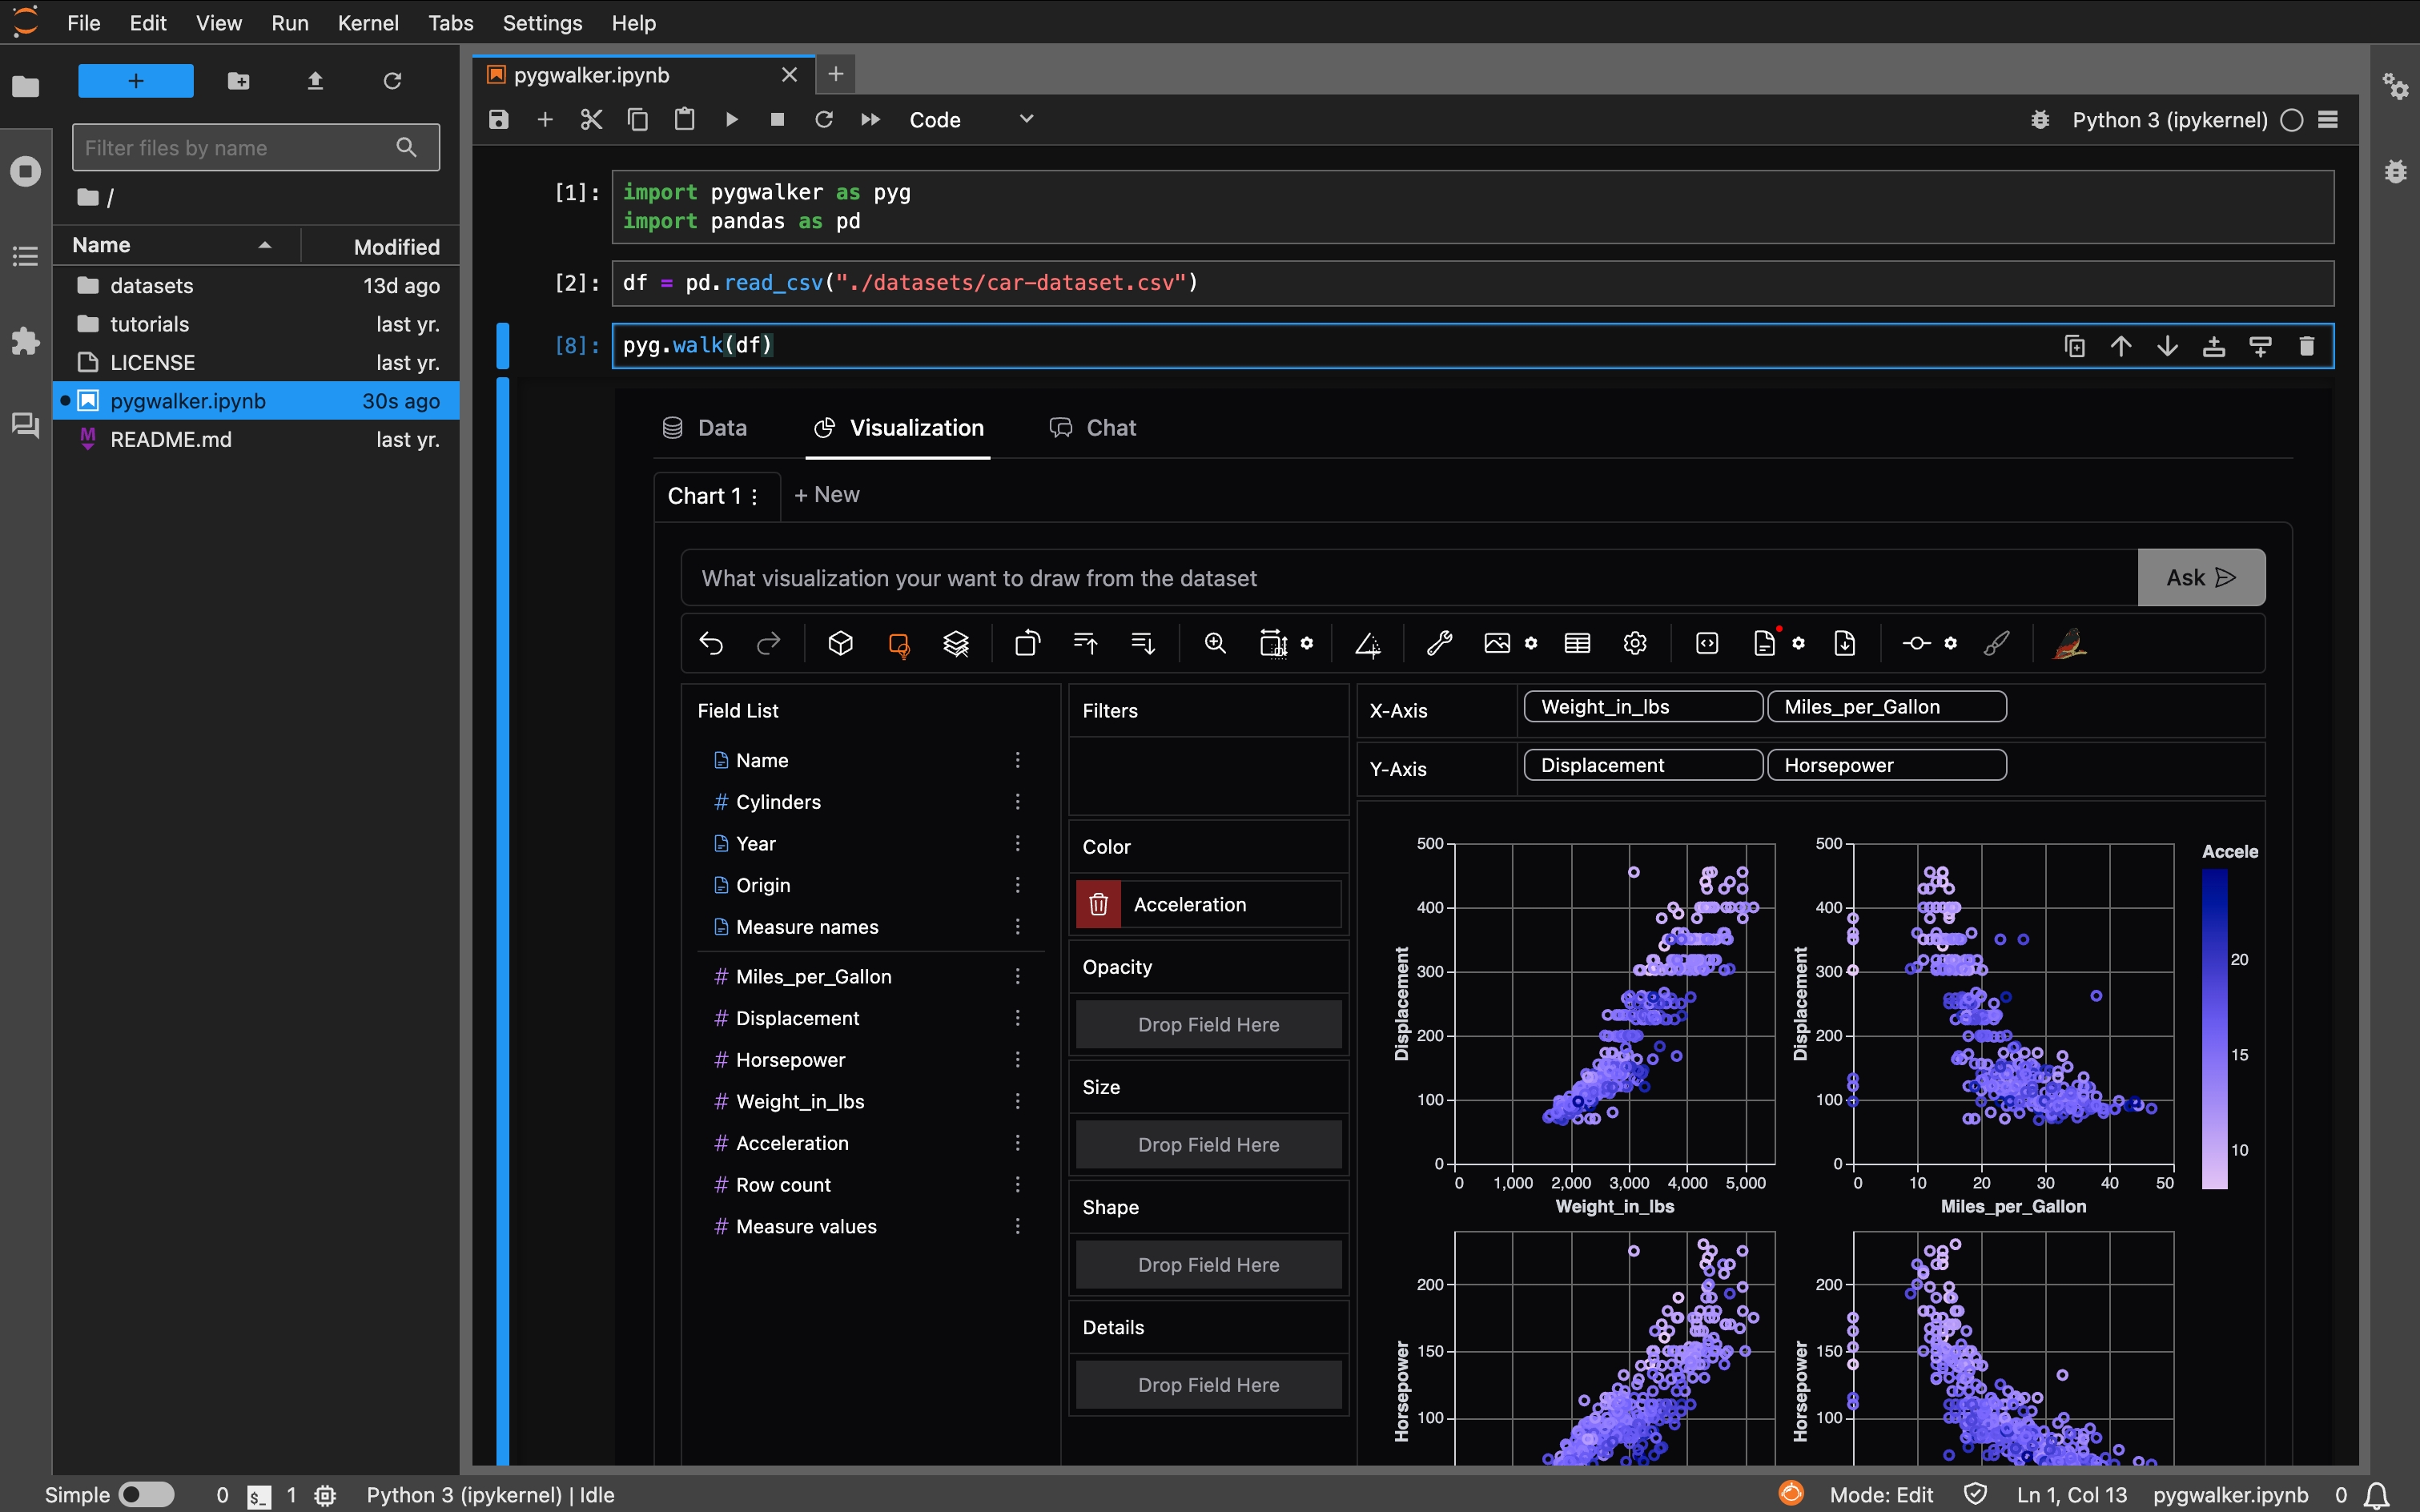
PyGWalker
Trasforma il tuo DataFrame in un'app di analisi visiva interattiva con una riga di codice. Perfetto per i notebook Jupyter e l'esplorazione dei dati.
- •Integrazione su una riga con DataFrames panda
- •Visualizzazione interattiva drag-and-drop
- •Esporta e condividi le tue visualizzazioni
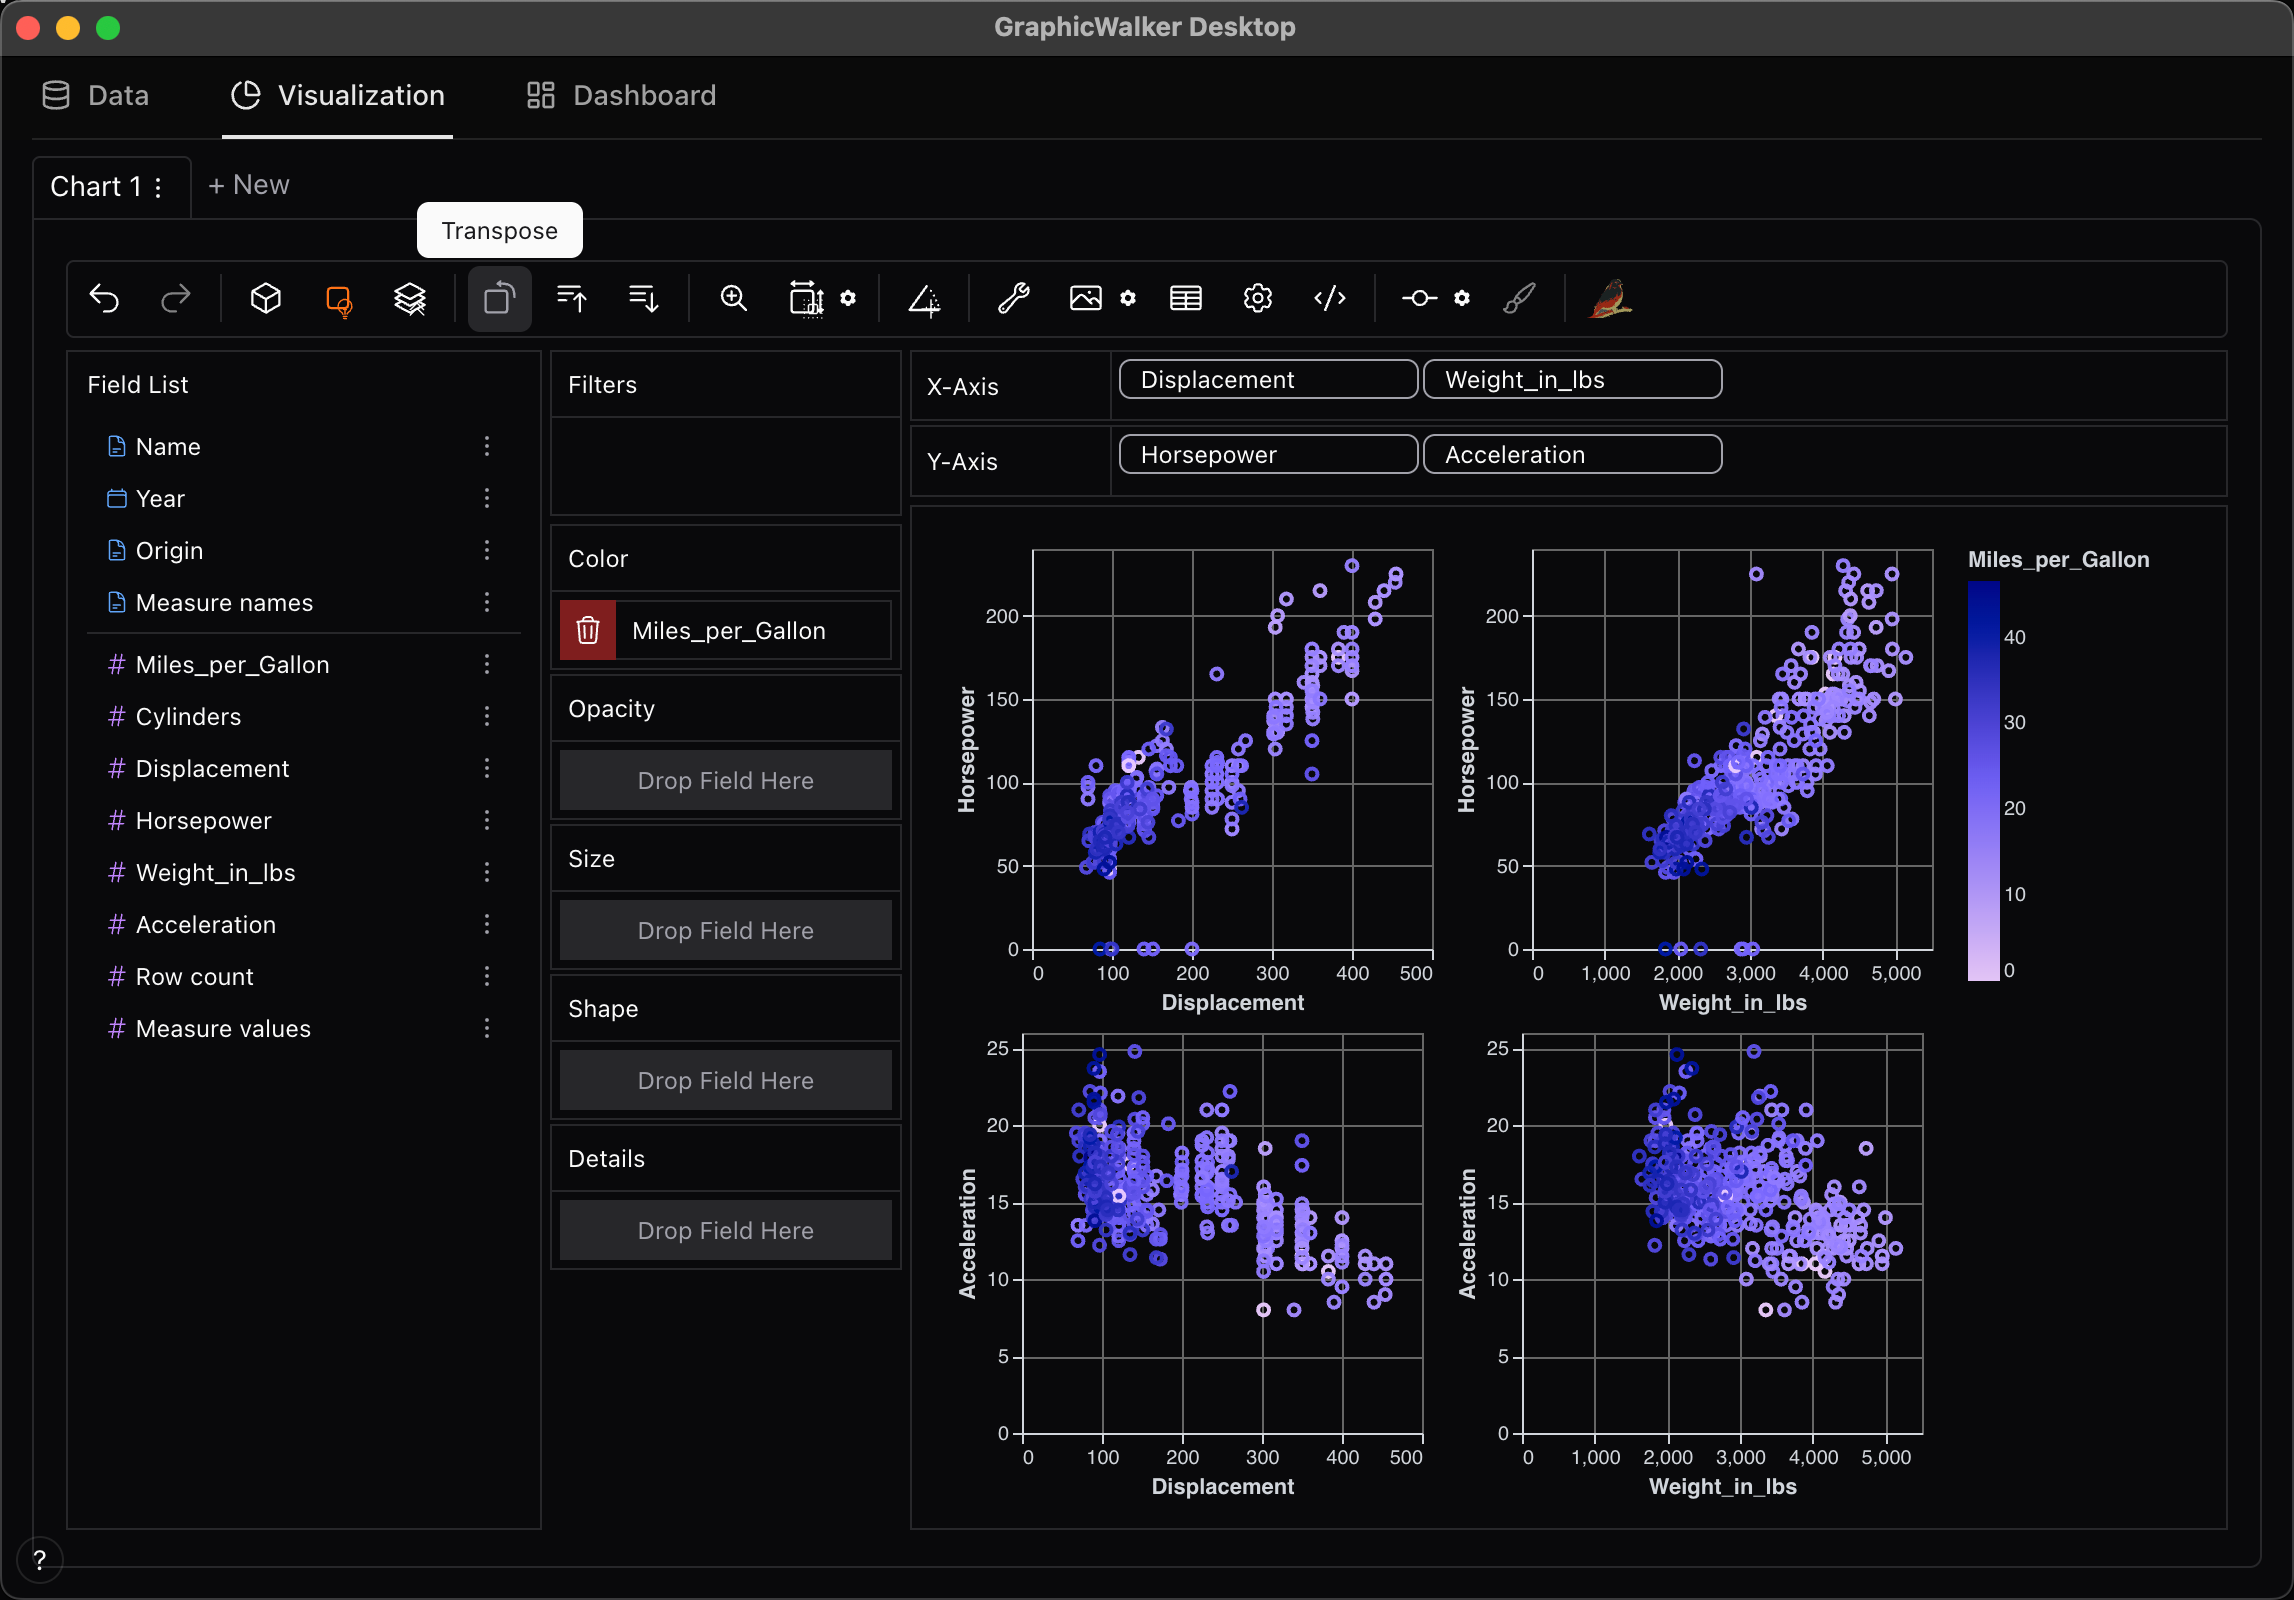
Graphic Walker Desktop
Il tuo editor di visualizzazione dei dati desktop con esplorazione istantanea dei dati ed EDA. Un'esperienza mirata per la creazione di visualizzazioni.
- •Applicazione desktop nativa per macOS e Windows
- •Elaborazione dati ad alte prestazioni
- •Funzionalità di analisi dei dati offline
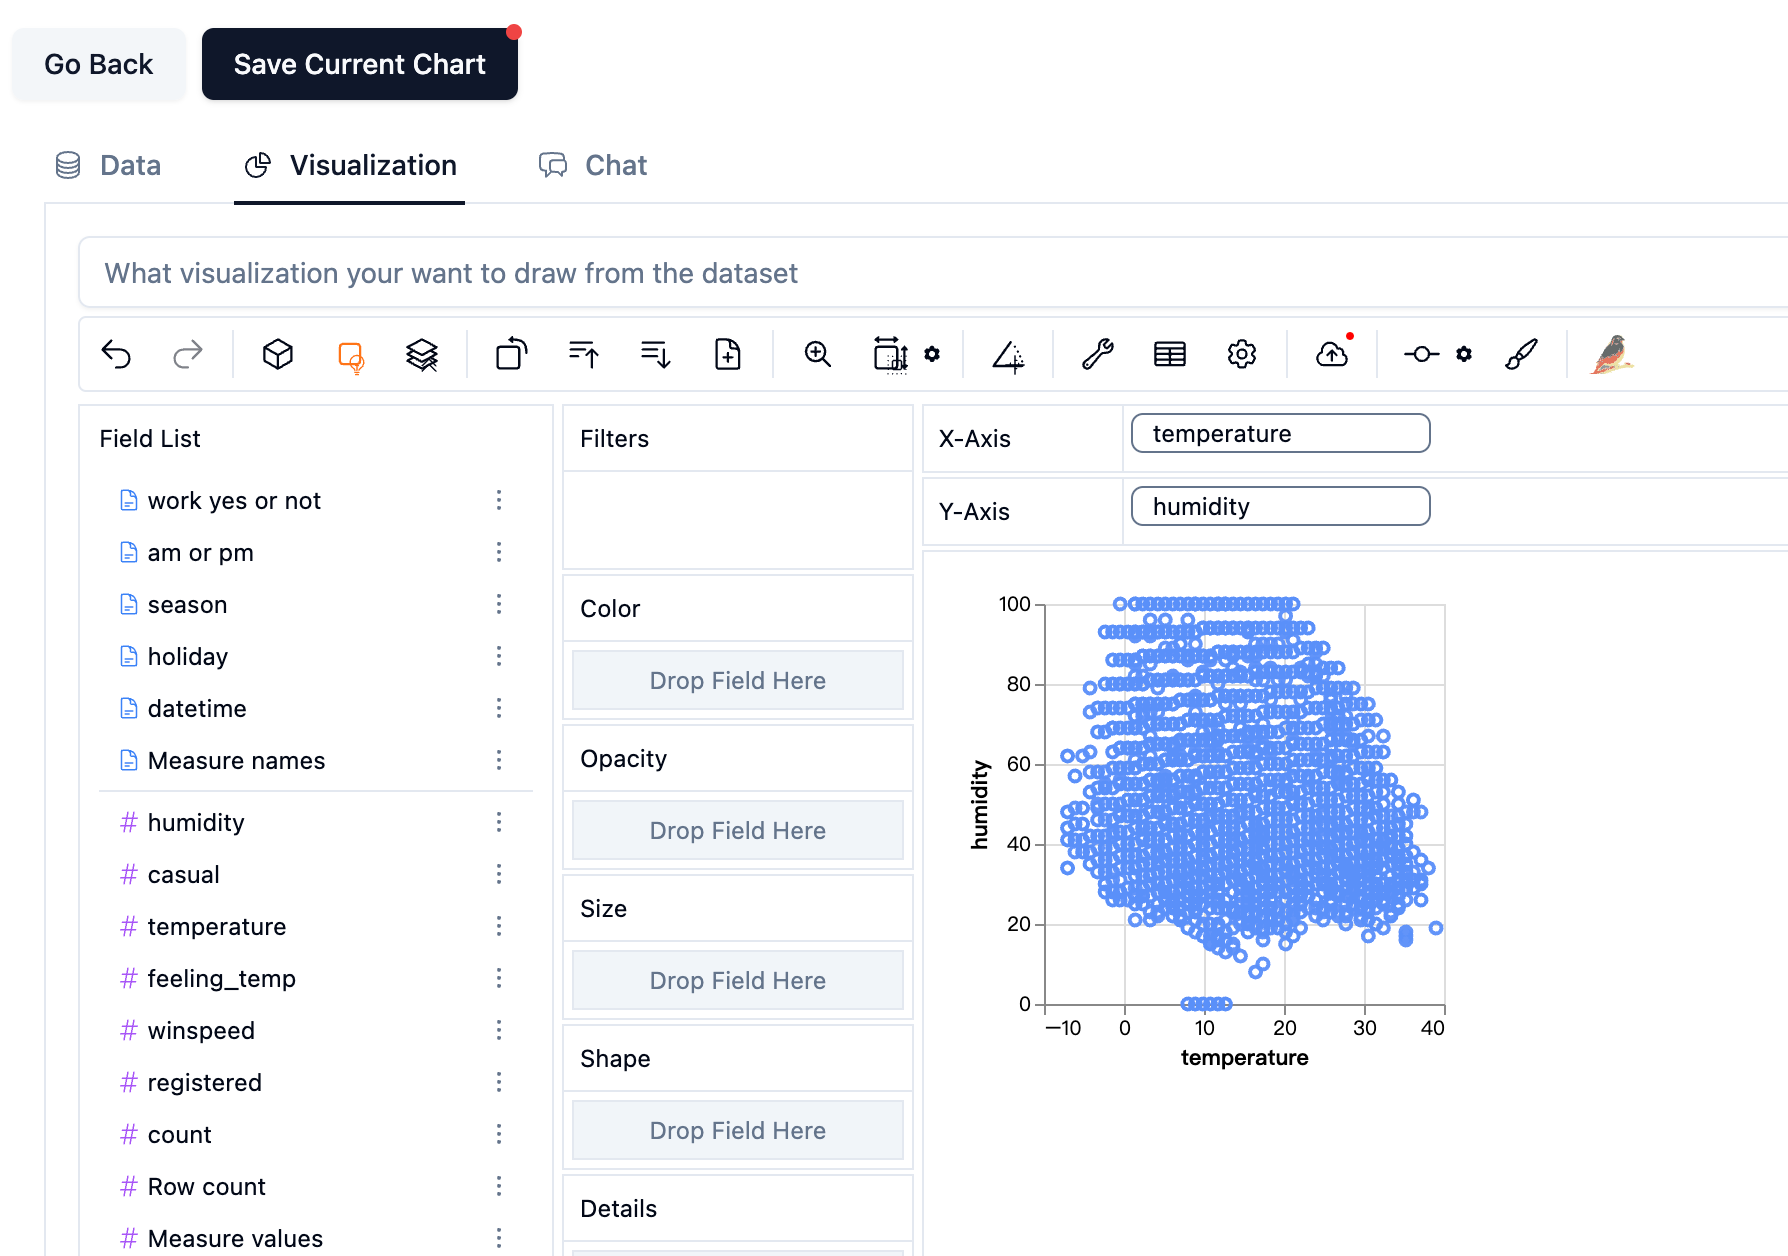
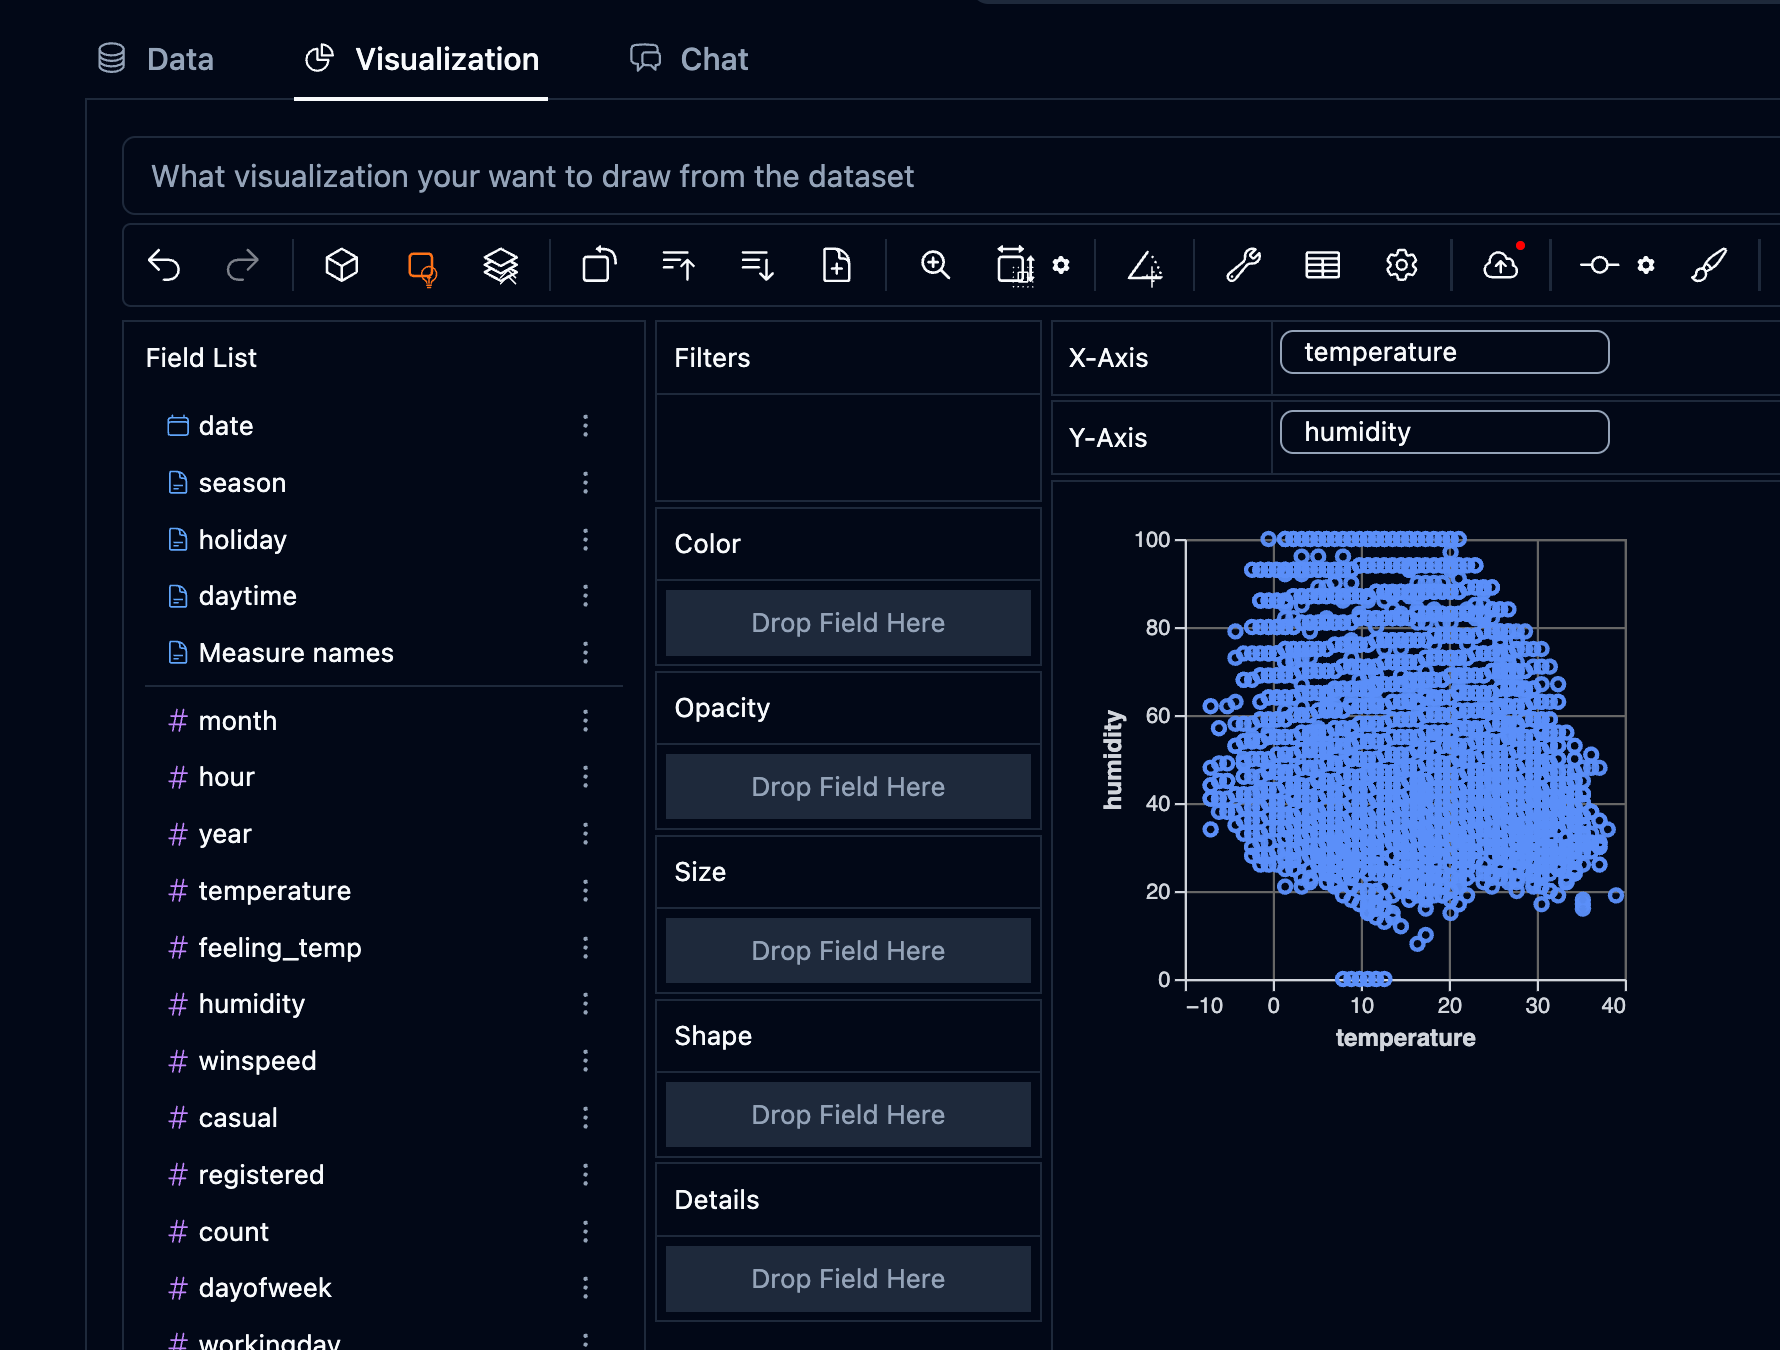
Graphic Walker Component
Componente di analisi visiva interattiva e incorporabile per le tue applicazioni web. Crea facilmente i tuoi strumenti BI.
- •Facile integrazione nelle app React/Vue/Angular
- •Interfaccia drag-and-drop per gli utenti finali
- •Esplorazione dei dati basata sull'intelligenza artificiale con la chat

GWalkR
App di visualizzazione interattiva dei dati nel tuo RStudio. Trasforma i tuoi frame di dati R in strumenti di esplorazione interattivi con una riga di codice.
- •Integrazione perfetta con RStudio
- •Grafici interattivi in R Markdown
- •Calcolo del kernel ad alte prestazioni
Analisi dei dati con collaborazione
Kanaries fornisce una serie di funzionalità che rendono l'analisi dei dati molto più semplice e sempre scalabile.
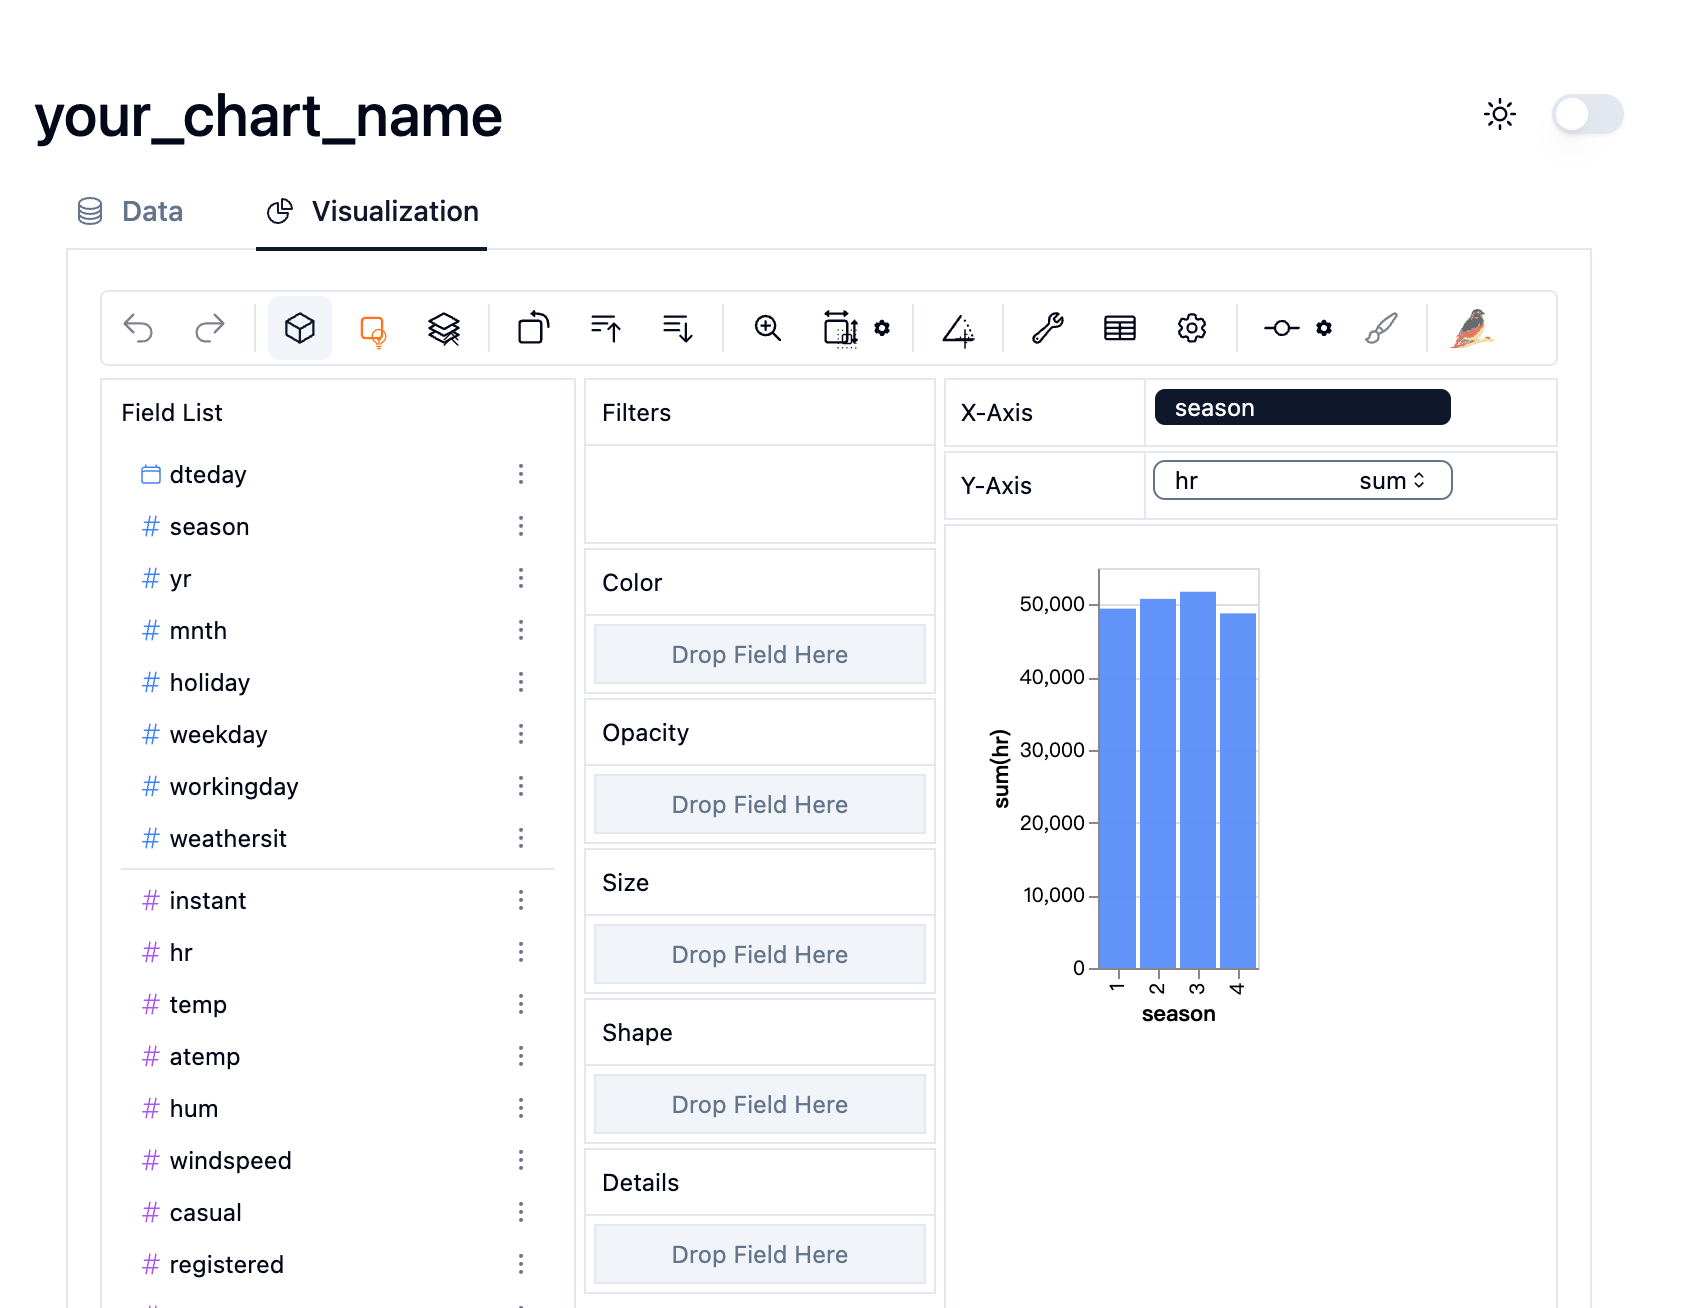
Sull'esplorazione dei dati di volo
Visualizza ed esplora i dati con semplici operazioni di trascinamento della selezione, al volo.
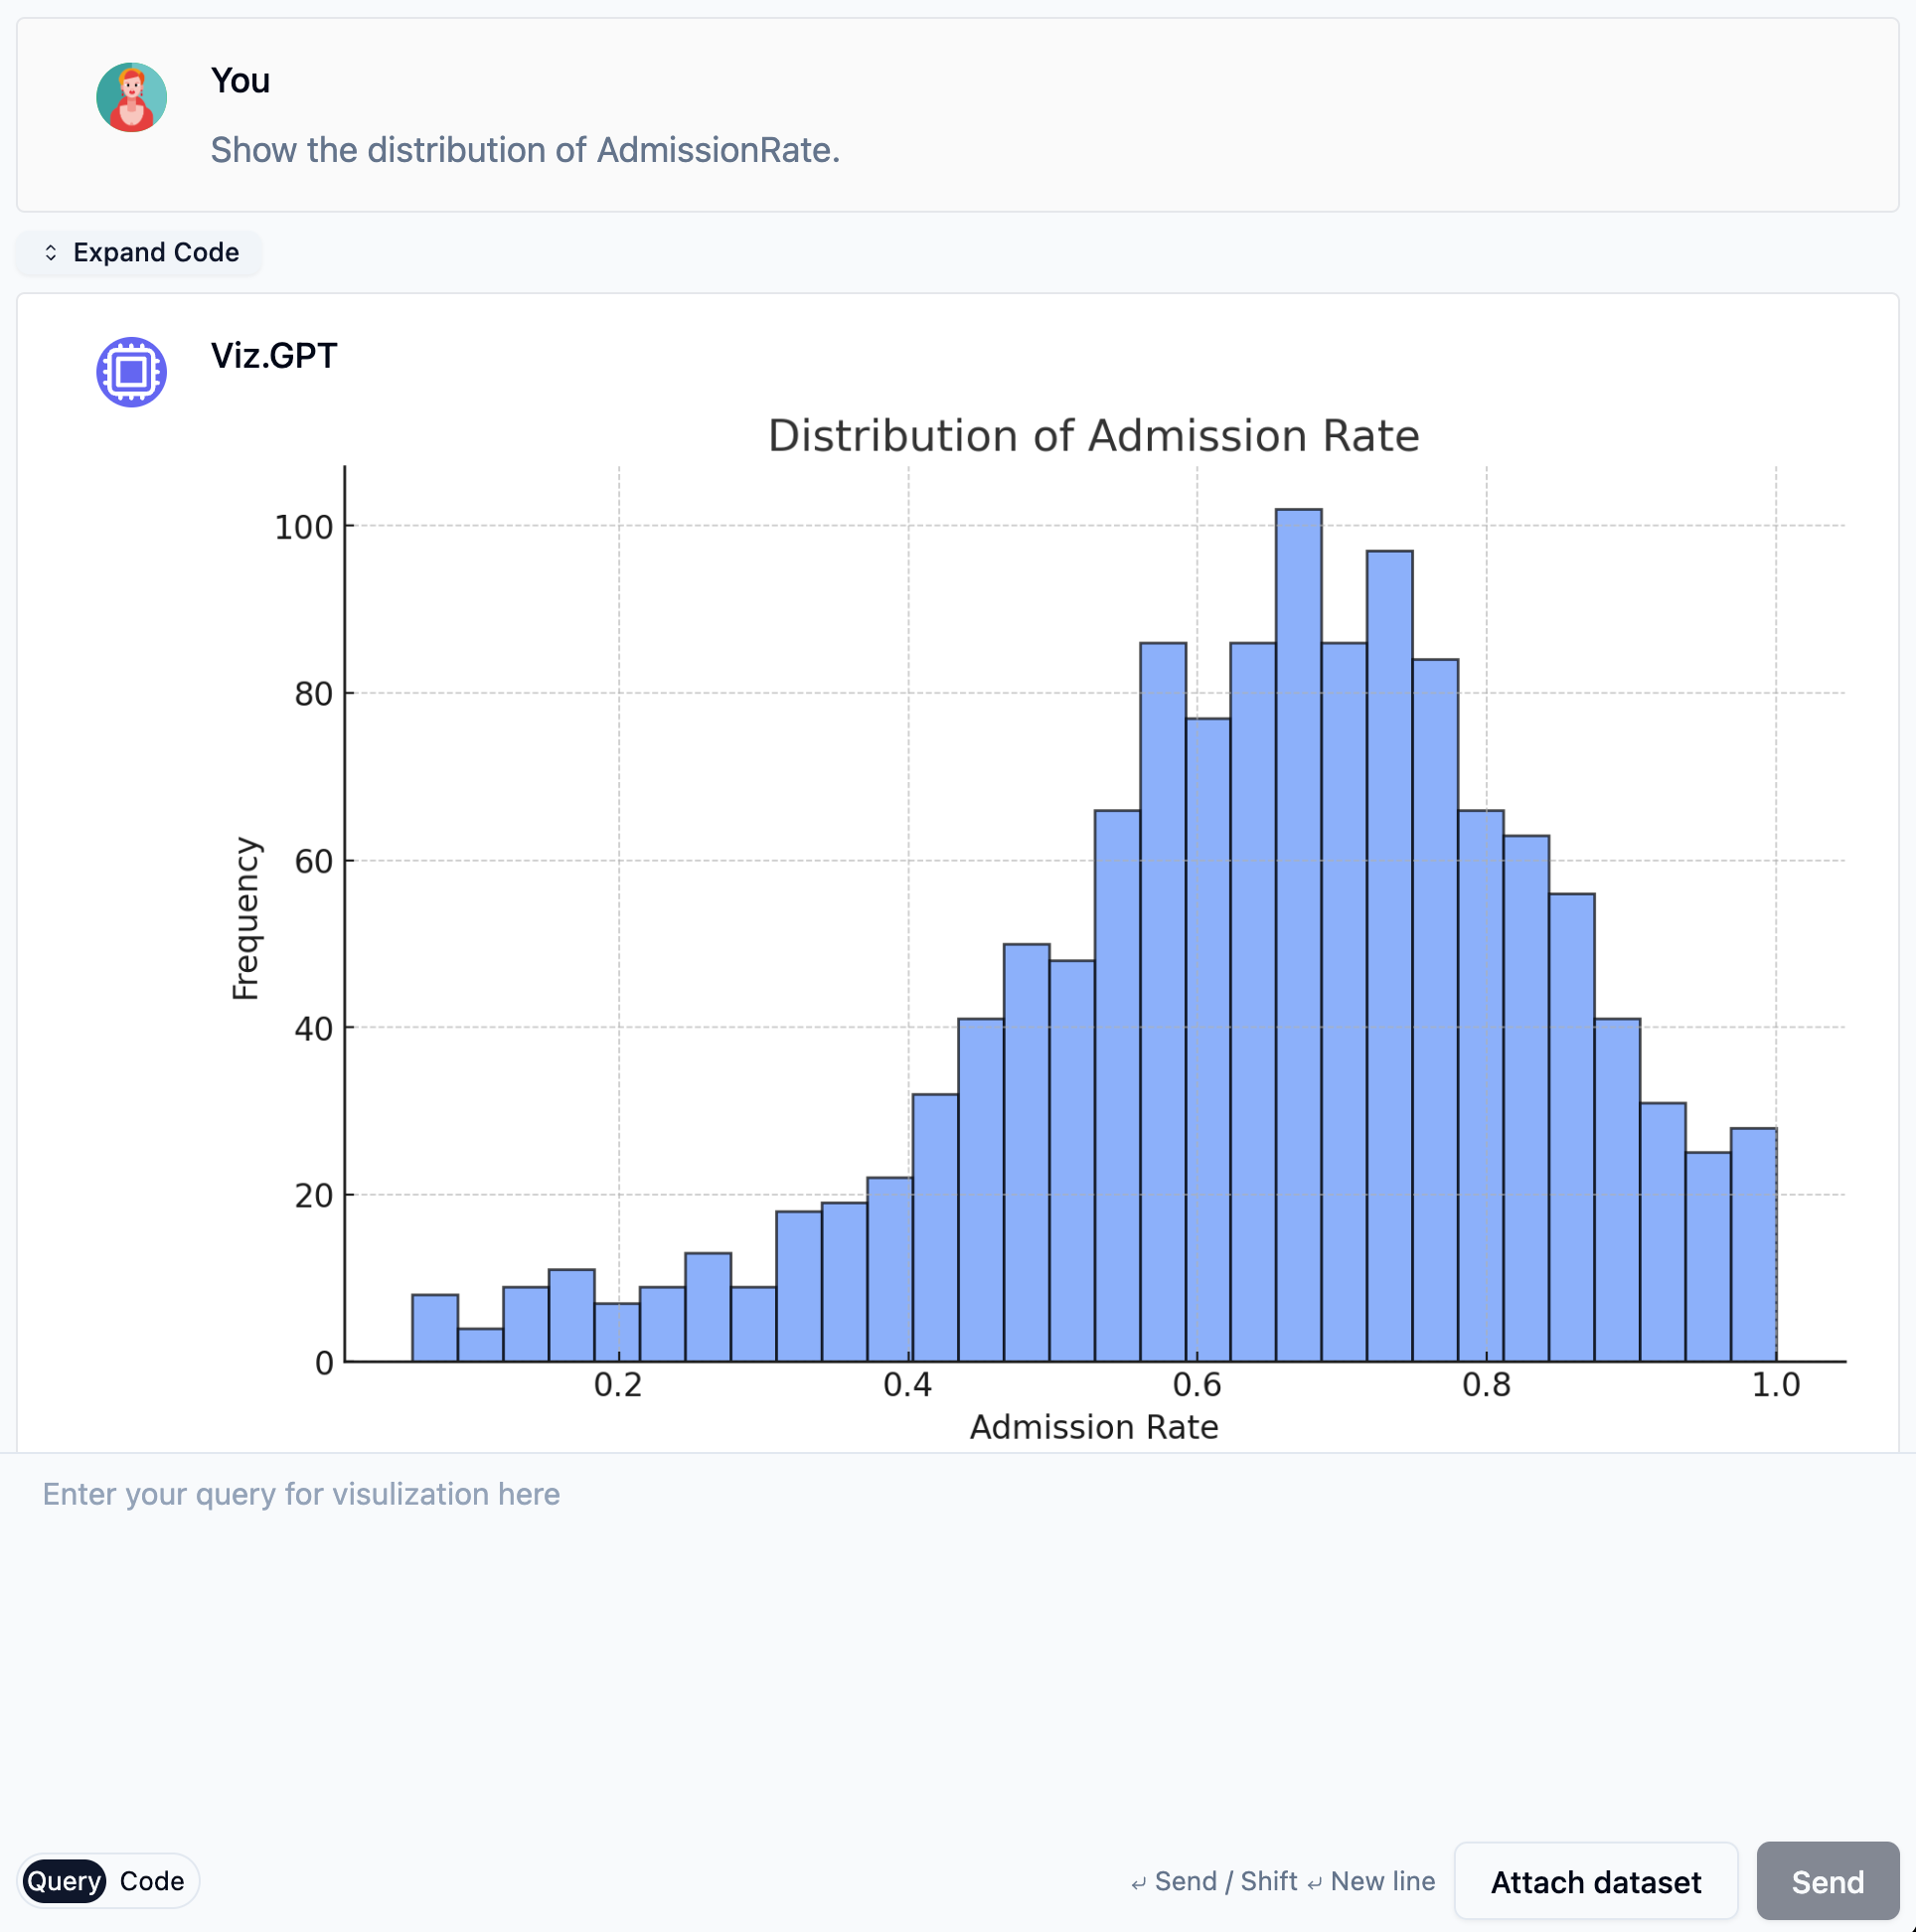
Esplora i dati con VizChat
Chatta con l'intelligenza artificiale per ottenere approfondimenti dai tuoi dati. Fai domande e ottieni risposte in linguaggio naturale.
Condividi grafici con i tuoi dati
Condividi i tuoi dati e grafici con il tuo team. Collabora con il tuo team per prendere decisioni migliori.
Pronto a sbloccare la potenza dei tuoi dati?
Vivi il futuro della visualizzazione dati. Provalo gratis oggi stesso.