埋め込み可能なビジュアル分析 Web コンポーネント
ドロップインのドラッグ アンド ドロップ分析。コンポーネント化されており、重い BI ツールではありません。データを小道具として渡し、どこにでも埋め込み、DuckDB コンピューティング、カスタム レンダラー、プッシュダウンを備えたエンタープライズ コネクタを使用して拡張します。
クイックスタート
import { GraphicWalker } from '@kanaries/graphic-walker';

export default function Dashboard({ data }) {
  return (
    <GraphicWalker
      data={data}
      fields={fields}
      spec={spec}
    />
  );
}
グラフィックウォーカーの違い
別の重い BI プラットフォームではありません。 Graphic Walker は、React アプリケーションとシームレスに統合する、構成可能で埋め込み可能な分析コンポーネントを提供します。
コンポーネント化された埋め込み可能な BI
React コンポーネントとして使用: データをプロップとして渡し、ドラッグ アンド ドロップでチャートをレンダリングします。あらゆるアプリ内で動作します。
独自のレンダラーを導入する
Graphic Walker の UI を好みのチャート ライブラリと組み合わせて使用し、一貫したルック アンド フィールを維持します。
ローカルから倉庫までスケールアップ
高速なローカル/エッジ コンピューティングのための DuckDB ベースのエンジン。 ClickHouse、StarRocks、または Snowflake へのエンタープライズ プッシュダウン。
開発者向けに構築
柔軟なエンコーディングのためのグラフィック文法スタイルの UI。レスポンシブ UX の Web ワーカー。ユーティリティ/フックを介して拡張します。
使用例
組み込み製品分析から内部ダッシュボードまで、Graphic Walker はお客様のニーズに適応します。
製品に分析を埋め込む
顧客向けのマルチテナント分析を SaaS アプリケーションに追加する
- アプリのデザインシステムとのシームレスな統合
- コンポーネントレベルでのデータアクセスと権限の制御
- 単純なグラフから複雑なビジュアライゼーションまで拡張可能
内部分析コンソール
強力な運用ダッシュボードとビジネス インテリジェンス ツールを構築する
- React コンポーネントを使用した迅速な開発
- 複数のデータソースに接続する
- 特定のメトリクスのカスタム視覚化
データ探索ワークベンチ
製品チームと運用チームが独立してデータを探索できるようにする
- 直感的なドラッグアンドドロップインターフェイス
- SQLの知識は必要ありません
- 洞察をエクスポートして視覚化を共有する
カスタム視覚化エクスペリエンス
チャート ライブラリを使用して独自のデータ エクスペリエンスを作成する
- レンダリングとスタイルを完全に制御
- 複数のチャートライブラリを結合する
- ドメイン固有のビジュアライゼーションを構築する
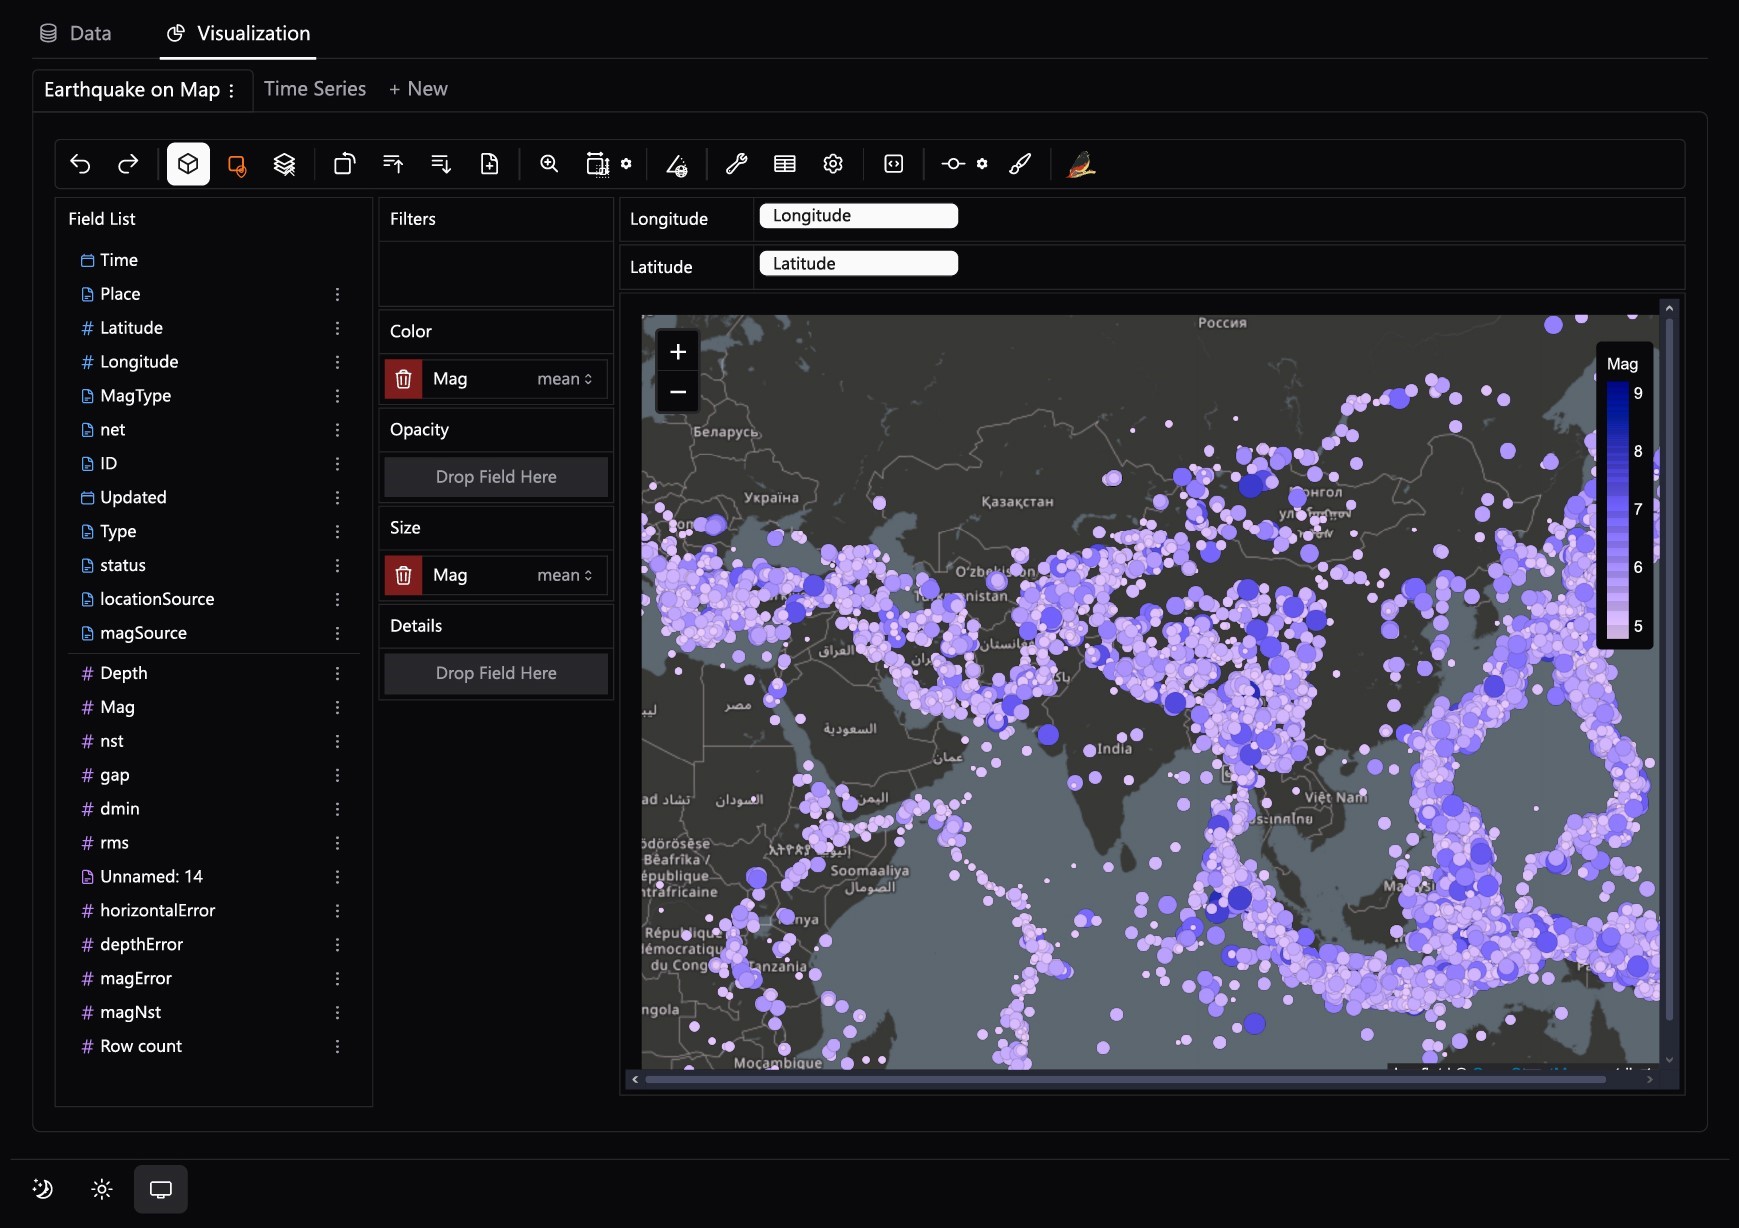
数回のクリックでデータをマッピング
Graphic Walker を使用すると、地理データを数秒でインタラクティブなマップに変換できます。直感的なコントロールで場所をズーム、パン、探索できます。マッピングの専門知識は必要ありません。

高性能 / スケーラブル
業界をリードするスピードと効率で大量のデータセットを処理します。 Graphic Walker は、高性能 DuckDB エンジンを通じてクエリを実行し、Snowflake や ClickHouse などの外部ウェアハウスに計算をプッシュできます。
エンタープライズ機能
大規模な分析を組み込むチーム向けの本番環境に対応した機能。
データベースコネクタとクエリプッシュダウン
データを VPC に保持します。最適なパフォーマンスとセキュリティを実現するために、計算をデータ ウェアハウスに直接プッシュします。
- クリックハウス
大規模なリアルタイム分析
- スターロックス
高パフォーマンスの OLAP クエリ
- スノーフレーク
クラウドネイティブなデータウェアハウス
// Enterprise Architecture

┌─────────────┐     ┌──────────────┐
│  Your App   │────▶│ Graphic      │
│   (React)   │     │   Walker     │
└─────────────┘     └─────┬───────┘
                           │
                    ┌──────▼───────┐
                    │ Query Engine │
                    └──────┬───────┘
                           │
              ┌────────────┼────────────┐
              ▼            ▼            ▼
        ┌─────────┐  ┌──────────┐  ┌───────┐
        │ DuckDB  │  │ClickHouse│  │ Snow- │
        │ (Local) │  │(Pushdown)│  │ flake │
        └─────────┘  └──────────┘  └───────┘
ガバナンスとセキュリティ
ロールベースのアクセス制御、監査ログ、データ系統の追跡。
サポートとSLA
優先サポート、保証された応答時間、専任のサクセス マネージャー。
カスタム開発
特定のニーズに合わせたカスタム コネクタ、機能、統合。
グラフィック ウォーカー vs ヘビー BI
コンポーネント化された BI が組み込み分析の未来である理由。
| 特徴 | モノリシックBI | グラフィックウォーカー |
|---|---|---|
| 導入のスピード | 数週間から数か月 | 数時間から数日 |
| フットプリント | 重いプラットフォーム | 軽量コンポーネント |
| カスタム UI コントロール | 限定されたテーマ | フルコントロール |
| ベンダーロックイン | 高い | なし |
| TCO | 高額なライセンス費用 | オープンソース + オプションのサポート |
| 埋め込み可能性 | iFrameのみ | ネイティブ React コンポーネント |
| テーマ設定 | プラットフォームのテーマ | あなたのデザインシステム |
| エンジンの柔軟性 | プラットフォーム固有の | DuckDB またはあなたの倉庫 |
| 拡張性 | 限定されたプラグイン | 完全な API アクセス |
よくある質問
グラフィック ウォーカーについて知っておくべきことすべて。
組み込み分析を自分の方法で構築
まずはオープンソースから始めましょう。必要なときにエンタープライズ機能に合わせて拡張します。
よりシンプルなツールをお探しですか?
エンタープライズ統合の価格設定
あなたに合ったプランをお選びください
Graphic Walker を製品に統合します。価格には、ライセンス料金とKanaries Cloudリソースの使用料が含まれています。詳細については、support@kanaries.org にお問い合わせください。
スタートアッププラン
$199/month/domain
$1,900 毎年支払われる場合
購読するGraphic Walker をドメインに統合するための重要な機能。 Kanaries Cloud と OpenAPI に基づいています。
- 1ドメインの統合ライセンス
- 15 のKanaries Pro シート (デスクトップ、クラウドを含む)
- 開発サポートチームへのアクセス
- 48時間のサポート対応を保証
企業
$2,000/month/domain
$20,000 毎年支払われる場合
営業担当者へのお問い合わせブランドのホワイトラベルライセンスとの高度な統合。
- セルフホスト統合ライセンス
- 50 のKanaries Pro シート (デスクトップ、クラウドを含む)
- 24 時間対応の優先サポート
- 追加ドメインの統合ライセンスが利用可能